

Group of confident business people point to graphs and charts to analyze market data, balance sheet, account, net profit to plan new sales strategies to increase production capacity.
Коллекция по умолчанию
Коллекция по умолчанию
Создать новую

Business graph and chart on cityscape background. Financial and trade concept. Double exposure
Коллекция по умолчанию
Коллекция по умолчанию
Создать новую

Chart graph paper. Finance, account, statistic, investment data economy, stock exchange business.
Коллекция по умолчанию
Коллекция по умолчанию
Создать новую

Group of business women working on a financial data expenses document.
Коллекция по умолчанию
Коллекция по умолчанию
Создать новую

Many type of infographic diagram over white background. Top view.
Коллекция по умолчанию
Коллекция по умолчанию
Создать новую

change in the exchange rate, trading charts on the close-up lcd screen
Коллекция по умолчанию
Коллекция по умолчанию
Создать новую

Charts of financial instruments with various type of indicators including volume analysis for professional technical analysis Smartphone and business stock application. Fundamental and technical analysis concept.
Коллекция по умолчанию
Коллекция по умолчанию
Создать новую

Economic growth, recession. Electronic virtual platform showing trends and stock market fluctuations
Коллекция по умолчанию
Коллекция по умолчанию
Создать новую

Financial Column Chart with Glowing Lines on a Dark Background, Data Analysis, Stock Market Concept
Коллекция по умолчанию
Коллекция по умолчанию
Создать новую

Fundamental and technical analysis concept. Various type of financial and investment products in Bond market
Коллекция по умолчанию
Коллекция по умолчанию
Создать новую

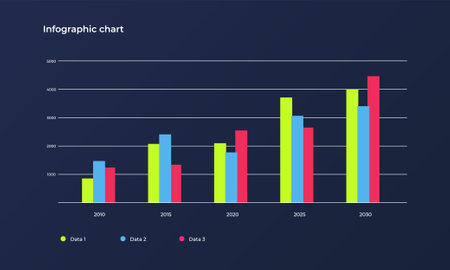
infographic graph chart data vector illustration eps10
Коллекция по умолчанию
Коллекция по умолчанию
Создать новую

Business chart with line graph, bar chart and numbers on dark background, 3d rendering. Computer digital drawing.
Коллекция по умолчанию
Коллекция по умолчанию
Создать новую

2022 concept. Graph of economics growth. Corpotare concept new year. Mixed Media
Коллекция по умолчанию
Коллекция по умолчанию
Создать новую

financial chart on the table, stock market data analysis, business concept
Коллекция по умолчанию
Коллекция по умолчанию
Создать новую

Image of multiple changing numbers over statistical and stock market data processing. Global economy and business data technology concept
Коллекция по умолчанию
Коллекция по умолчанию
Создать новую

Sustainable portfolio management, long term wealth management with risk diversification concept.
Коллекция по умолчанию
Коллекция по умолчанию
Создать новую

Multi exposure of financial graph with man works in office on background. Concept of analysis.
Коллекция по умолчанию
Коллекция по умолчанию
Создать новую

stock chart with indicator
Коллекция по умолчанию
Коллекция по умолчанию
Создать новую

Composite of data processing over grid and landscape. Global data processing and computing concept digitally generated video.
Коллекция по умолчанию
Коллекция по умолчанию
Создать новую

accounting of profit summary graphs analysis. The business plan at the meeting and analyze financial numbers to view the performance
Коллекция по умолчанию
Коллекция по умолчанию
Создать новую

Many graphs horizontal
Коллекция по умолчанию
Коллекция по умолчанию
Создать новую

Top down view of start up business team holding paper while discussing about financial idea. Aerial view of smart diverse people brainstorming idea while looking at stock market statistic. Symposium.
Коллекция по умолчанию
Коллекция по умолчанию
Создать новую

Portrait of business people sit conference room check annual results graph report loft office indoors
Коллекция по умолчанию
Коллекция по умолчанию
Создать новую

multi color bar charts with two different pencils
Коллекция по умолчанию
Коллекция по умолчанию
Создать новую

Stock Market Trading Chart Investment Analysis Business Index Chart Finance Board Chart
Коллекция по умолчанию
Коллекция по умолчанию
Создать новую

Income, profit, statistics and performance evaluation with diagram
Коллекция по умолчанию
Коллекция по умолчанию
Создать новую
Set of growing bar graph icons. Business chart with arrow. Growths chart collection. Statistics and analytics. Vector isolated illustration.
Коллекция по умолчанию
Коллекция по умолчанию
Создать новую

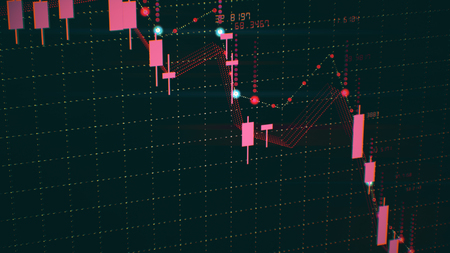
Candle price chart with indicators on a white background close-up. Online trading of stocks and cryptocurrencies on the stock exchange
Коллекция по умолчанию
Коллекция по умолчанию
Создать новую

Businesswomen analyzing financial data charts in an outdoor meeting
Коллекция по умолчанию
Коллекция по умолчанию
Создать новую

business hand working on laptop computer with financial business graph information diagram on wooden desk as concept
Коллекция по умолчанию
Коллекция по умолчанию
Создать новую

An algorithm predicting market trends based on history
Коллекция по умолчанию
Коллекция по умолчанию
Создать новую

Graphs and financial statistic, business concept. Financial report
Коллекция по умолчанию
Коллекция по умолчанию
Создать новую
Futuristic digital business forex currency candle chart fall. 3D illustration of financial diagram falls on bearish market, showing recession or financial crisis. Econimics concept in ultra HD 4K
Коллекция по умолчанию
Коллекция по умолчанию
Создать новую

Stock market graph. Big data visualization. investment graph concept.
Коллекция по умолчанию
Коллекция по умолчанию
Создать новую
Multi exposure of virtual abstract financial chart and upward arrow interface on a modern meeting room background, rise and breakthrough concept
Коллекция по умолчанию
Коллекция по умолчанию
Создать новую

Financial data graph at stock exchange
Коллекция по умолчанию
Коллекция по умолчанию
Создать новую
modern infographic vector template with statistics graphs and finance charts. Diagram template and chart graph, graphic information visualization illustration
Коллекция по умолчанию
Коллекция по умолчанию
Создать новую

Accounting company provide finance and taxation planning for profitable cash flow, Auditor and accountant team working in office, analyze financial data and accounting record with calculator.Insight
Коллекция по умолчанию
Коллекция по умолчанию
Создать новую
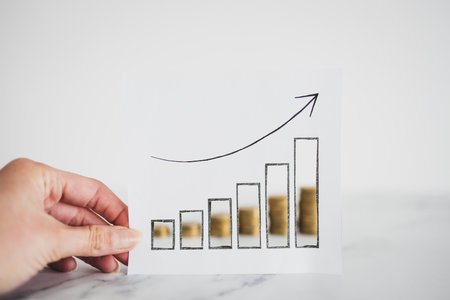
inflation increasing or investments going well conceptual image, cutout graph with stats going up and stacks of coins visible through it
Коллекция по умолчанию
Коллекция по умолчанию
Создать новую

analysis for professional technical analysis on the monitor of a computer. Fundamental and technical analysis concept.
Коллекция по умолчанию
Коллекция по умолчанию
Создать новую

Forex market graph hologram and personal computer on background. Multi exposure. Concept of investment.
Коллекция по умолчанию
Коллекция по умолчанию
Создать новую

A tidy workspace shows graphs and charts with a laptop and smartphone, highlighting productivity.
Коллекция по умолчанию
Коллекция по умолчанию
Создать новую

Business paper Line graph on desk.
Коллекция по умолчанию
Коллекция по умолчанию
Создать новую

Data graph, retro futuristic visualisation of diagrams and finance graphics, AI generative
Коллекция по умолчанию
Коллекция по умолчанию
Создать новую

Stock market chart. Business graph background. Forex trading. business concept in color
Коллекция по умолчанию
Коллекция по умолчанию
Создать новую

Stock market graph on led screen. Finance and investment concept. Selective focus.
Коллекция по умолчанию
Коллекция по умолчанию
Создать новую

The fall of coronavirus exchanges . Businessman hand working on analyzing investment charts for Gold market, Forex market and Trading market.
Коллекция по умолчанию
Коллекция по умолчанию
Создать новую

Stock market graph. Graphics growth forex finance market on tablet screen. Financial chart, stock analysis data for business background. Investment and economic concept
Коллекция по умолчанию
Коллекция по умолчанию
Создать новую

Chart graph paper. Finance, account, statistic, investment data economy, stock exchange business.
Коллекция по умолчанию
Коллекция по умолчанию
Создать новую

Financial charts and pie graphs image over global data analysis background. Finance, economy, statistics, pie chart, business, metrics
Коллекция по умолчанию
Коллекция по умолчанию
Создать новую

Stock market business graph chart on digital screen.Forex market, Gold market and Crude oil market.
Коллекция по умолчанию
Коллекция по умолчанию
Создать новую

Right direction of your business. Collage
Коллекция по умолчанию
Коллекция по умолчанию
Создать новую

Analyzing price movements a visual representation on a blue background in photography
Коллекция по умолчанию
Коллекция по умолчанию
Создать новую

A graph made from a red arrow on top of colored columns pointing towards a key on black background, shot from above.
Коллекция по умолчанию
Коллекция по умолчанию
Создать новую

Graphs paper. Financial development, Banking Account, Statistic, Investment Analytic research data economy.
Коллекция по умолчанию
Коллекция по умолчанию
Создать новую

Digital Business Growth, Colorful Graphs and Charts on Multiple Screens Illustrating Success
Коллекция по умолчанию
Коллекция по умолчанию
Создать новую

Business success and growth concept. Stock market business graph chart on digital screen. Forex market, Gold market and Crude oil market.
Коллекция по умолчанию
Коллекция по умолчанию
Создать новую

Business image
Коллекция по умолчанию
Коллекция по умолчанию
Создать новую

Business and Technology target set goals and achievement in 2023 new year resolution statistics graph rising revenue, planning to start up strategy, icon concept
Коллекция по умолчанию
Коллекция по умолчанию
Создать новую

Top view of business people and graphs and diagrams on floor
Коллекция по умолчанию
Коллекция по умолчанию
Создать новую

Business success and growth concept.Stock market business graph chart on digital screen.Forex market, Gold market and Crude oil market .
Коллекция по умолчанию
Коллекция по умолчанию
Создать новую

Stock market business and exchange financial growth graph. Growth up graph business financial investment or economic concept.
Коллекция по умолчанию
Коллекция по умолчанию
Создать новую

gold number 2023 on business background 3d rendering
Коллекция по умолчанию
Коллекция по умолчанию
Создать новую

Abstract background with growing charts and flowing counters of numbers with symbols of percent and gain. Financial figures and diagrams showing increasing profits
Коллекция по умолчанию
Коллекция по умолчанию
Создать новую

Multi exposure of forex graph hologram over desktop with phone. Top view. Mobile trade platform concept.
Коллекция по умолчанию
Коллекция по умолчанию
Создать новую

note paper with finance business graph going up - green profit
Коллекция по умолчанию
Коллекция по умолчанию
Создать новую

Mans hand pointing graph of success in 2023 year. Growing business concept
Коллекция по умолчанию
Коллекция по умолчанию
Создать новую

financial instruments with various types of indicators including volume analysis for professional technical analysis on the monitor of a computer.
Коллекция по умолчанию
Коллекция по умолчанию
Создать новую

Digital graph chart diagrams data of cryptocurrency, stock market or forex exchange price on computer display screen. Global business economy and financial rate on technology monitor. Money investment
Коллекция по умолчанию
Коллекция по умолчанию
Создать новую

Коллекция по умолчанию
Коллекция по умолчанию
Создать новую

Image of statistics and financial data processing over grid. global business, finances, data processing, digital interface and technology concept digitally generated image.
Коллекция по умолчанию
Коллекция по умолчанию
Создать новую

Graph and stock market statistics. Forex trading analysis
Коллекция по умолчанию
Коллекция по умолчанию
Создать новую

Stock Market Loss Trading Chart Investment Analysis Business Index Chart Finance Board Chart
Коллекция по умолчанию
Коллекция по умолчанию
Создать новую

Close up of business people working with business document during discussion at meeting.
Коллекция по умолчанию
Коллекция по умолчанию
Создать новую

Double exposure of financial chart drawing and desktop with coffee and items on table background. Concept of forex market trading
Коллекция по умолчанию
Коллекция по умолчанию
Создать новую

Business team collaboration discussing working analyzing with financial data and marketing growth report graph in team, presentation and brainstorming to strategy planning making profit of company.
Коллекция по умолчанию
Коллекция по умолчанию
Создать новую

art color graph illustration background
Коллекция по умолчанию
Коллекция по умолчанию
Создать новую

stock trade graph candlestick financial investment trade, Forex graph business or Trading crypto currency technical price with indicator on chart screen trend
Коллекция по умолчанию
Коллекция по умолчанию
Создать новую

Pie chart, target and arrow, business development concept, data analysis report, financial growth, 3d rendering. 3d illustration.
Коллекция по умолчанию
Коллекция по умолчанию
Создать новую

business graph, chart, diagram, bar
Коллекция по умолчанию
Коллекция по умолчанию
Создать новую

Digital marketing 2023 goals. Businessman analyzing internet marketing online, 2023 business planning, business skyrocket, online stock market analysis, stock chart next year, digital stock trading
Коллекция по умолчанию
Коллекция по умолчанию
Создать новую

Image of graphs, trading boards, loading circles over aerial view of modern cityscape. Digital composite, multiple exposure, report, business, stock market, progress and architecture concept.
Коллекция по умолчанию
Коллекция по умолчанию
Создать новую

A stock chart with a line graph on it, stock market or forex trading grap
Коллекция по умолчанию
Коллекция по умолчанию
Создать новую

Shining rise up arrow draw by man, growing on business chart graph from 2022 to 2023 year calendar. Investment technology, financial, return on investment - ROI, profit, and success process concept.
Коллекция по умолчанию
Коллекция по умолчанию
Создать новую

Glitch overlay. Distressed screen. Digital noise. Orange blue color artifacts dust scratches texture on dark black illustration abstract background.
Коллекция по умолчанию
Коллекция по умолчанию
Создать новую

Double exposure of forex graph drawing over people taking notes background. Concept of financial analysis
Коллекция по умолчанию
Коллекция по умолчанию
Создать новую

Close-up view of business document with charts and graphs, blue pen on a wooden table.
Коллекция по умолчанию
Коллекция по умолчанию
Создать новую

Double exposure of forex graph hologram over desktop with phone. Top view. Mobile trade platform concept.
Коллекция по умолчанию
Коллекция по умолчанию
Создать новую

Multi exposure of stock market chart drawing and office interior background. Concept of financial analysis.
Коллекция по умолчанию
Коллекция по умолчанию
Создать новую

Financial static analysis with growing financial charts. Online trading, Investment, Strategy market plan, and Stock market fluctuations Concept.
Коллекция по умолчанию
Коллекция по умолчанию
Создать новую

Dashboard infographic big data visualization, binary option, monitor screen in perspective, statistics and market analysis illustration
Коллекция по умолчанию
Коллекция по умолчанию
Создать новую

Financial analysts analyze business financial reports on a digital tablet planning investment project during a discussion at a meeting of corporate showing the results of their successful teamwork.
Коллекция по умолчанию
Коллекция по умолчанию
Создать новую

Multi exposure of stock market graph with man working on laptop on background. Concept of financial analysis.
Коллекция по умолчанию
Коллекция по умолчанию
Создать новую

Market chart with growth graph 3D illustration on color background
Коллекция по умолчанию
Коллекция по умолчанию
Создать новую

Candle stick graph chart with indicator showing bullish point or bearish point, up trend or down trend of price of stock market or stock exchange trading, investment and financial concept.
Коллекция по умолчанию
Коллекция по умолчанию
Создать новую

stock market exchange graph illustration concept 3d illustration
Коллекция по умолчанию
Коллекция по умолчанию
Создать новую

Candle chart of financial instrument, with averages and volume indicator
Коллекция по умолчанию
Коллекция по умолчанию
Создать новую

Bitcoin market price candlesticks on the crypto trading terminal screen. Cryptocurrency exchange
Коллекция по умолчанию
Коллекция по умолчанию
Создать новую

Technical price graph and indicator, red and green candlestick chart on blue theme screen, market volatility, up and down trend. Stock trading, crypto currency background.
Коллекция по умолчанию
Коллекция по умолчанию
Создать новую

data on a monitor which including of Market Analyze. Bar graphs, Diagrams, financial figures. Forex chart.
Коллекция по умолчанию
Коллекция по умолчанию
Создать новую
Legion-Media
Создайте свои проекты на основе качественных стоковых фотографий и видео.


Copyright © Legion-Media.